Grafana Log Dashboards — From Fleet Overview to Per-Host Detail
“Information is the oil of the 21st century, and analytics is the combustion engine.” — Peter Sondergaard
📬 The Inbox That Never Gets Checked
I have worked at a few companies that used email notifications as the primary way to monitor for system issues. It normally starts out small — a few critical alerts when a server goes down. Then it grows. Months later, you are getting notifications telling you that systems are running fine. Years later, notifications are still arriving daily for systems that no longer exist. Sooner or later, someone creates mail rules that filter out most messages, nobody has the time to clean up the old alerts, and eventually a critical notification gets missed.
That pattern keeps coming back to me when I think about centralized logging. Loki and Promtail will faithfully collect every log line from every host on your network. But a wall of raw logs from twelve machines is its own kind of inbox nobody checks. The data is there. The visibility is not — not until you build something to surface it.
That is what these two dashboards are for.
This article is part of an ongoing series documenting the build-out of a Linux-based corporate desktop and server environment. The previous articles established the monitoring stack — Prometheus for metrics, Loki for logs, and the Grafana Network Overview that shows the health of every host at a glance. This article adds two dashboards that extend that visibility into log data: a fleet-wide log summary that shows which hosts have problems, and a per-host detail view for investigating what those problems are.
If you haven’t read the Loki article or the Grafana Network Overview article, they provide the infrastructure context for everything covered here.
Table of Contents
- The Problem With Raw Log Access
- The Three-Screen Flow
- Dashboard 1 — Linux Log Summary
- Dashboard 2 — Linux Host Logs
- Why Do This?
- Part of a Larger Journey
🔍 The Problem With Raw Log Access
Centralised logging with Loki solves the collection problem. All your logs land in one place. You can query them with LogQL, filter by host, search for patterns across your entire fleet in seconds.
But “can query” is not the same as “actually monitors.”
Raw Loki access still requires intent. You have to open Grafana’s Explore tab, write a query, pick a time range, and look at the results. You do that when something is obviously wrong. You don’t do it every morning before anything else — not unless the information is already in front of you when you open the screen.
The manual approach also breaks down in specific ways as the number of hosts grows:
Time cost compounds. Checking logs on one host takes a few minutes. Checking ten takes most of your morning — and that assumes you remember to do it.
Context switching is expensive. Each host is a separate query, a separate mental context. By the time you’re looking at host six, you’ve lost the thread of what host two showed you.
Intermittent issues disappear. A service that crashes and recovers at 3am leaves a log entry and no visible symptom. You will never find it unless you happen to look at exactly the right time window.
You stop looking before something breaks. The whole value of logs is catching problems before they become incidents. If you only check logs when something is obviously wrong, you’ve already lost that advantage.
The dashboards below turn Loki from a tool you use reactively into a view you check passively — something you glance at and immediately know whether anything needs attention.
🏗️ The Three-Screen Flow
The design follows a single principle: narrow the problem at each step.
Three screens. One question each.
Home Network Overview — already covered in the previous article — shows every host’s resource metrics alongside a Log Errors count. When a host has errors, that cell turns red with the count. No errors, no colour — the cell is blank. That red number is a link directly to the Log Summary for that host.
Linux Log Summary answers: What kind of log activity does this host have?
It shows four stat panels for the selected host — errors, warnings, failed logins, invalid user attempts — and lets you compare across hosts if you widen the selection. A stat panel turns red when there are errors, yellow for warnings. When you know which problem type to investigate, a link takes you to the detail dashboard.
Linux Host Logs answers: What exactly do those log entries say?
It gives you the full picture for a single host: the same four stat panels, a time series of log volume broken down by severity, and three full log panel views — all logs, errors and warnings only, and the auth log specifically.
Each screen narrows the scope. The Network Overview tells you a host has errors. The Log Summary tells you what kind of errors. The Host Logs shows you the actual log lines.
📊 Dashboard 1 — Linux Log Summary
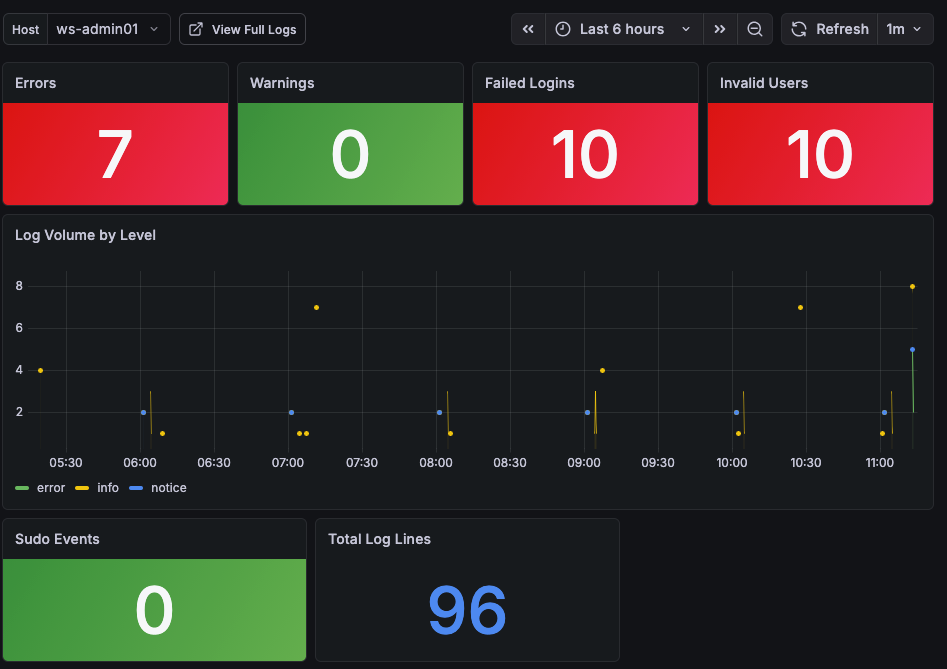 The Linux Log Summary dashboard showing error, warning, and security event counts for each host.
The summary dashboard is scoped to one host at a time, selected from a dropdown at the top of the screen. You arrive here from the Network Overview by clicking the error count link on a host row — the selected host is passed through automatically, so you land directly on the data that needs attention.
Seven stat panels give a complete picture of the selected host’s log activity over the chosen time range:
Errors — count of log lines matching error-level severity patterns: error, err, critical, crit, emerg, alert, fatal. The panel background turns red when the count is one or more, and green when it is zero. This is the primary signal that something needs investigation.
Warnings — count of warning-level log lines. Yellow background when warnings are present, green when clear.
Failed Logins — count of SSH and PAM authentication failures. Patterns matched include failed password, authentication failure, and failed login. Red when any are present.
Invalid Users — count of login attempts using usernames that do not exist on the system. These are almost always automated scanning attempts. Red when any are present.
Log Volume by Level — a time series showing log volume over the selected time range, broken down by severity level. This is useful for spotting when problems started — a spike in error-level volume at a specific time narrows the investigation window before you even open the detail screen.
Sudo Events — count of sudo invocations from the auth log. Unexpected sudo activity — especially outside business hours — can indicate privilege escalation attempts or a misconfigured service running as the wrong user.
Total Log Lines — the total number of log lines from this host in the selected time range. Useful as a baseline: a host that normally generates 2,000 lines in six hours and is suddenly generating 20,000 is telling you something, even if the error count is zero.
🔬 Dashboard 2 — Linux Host Logs
The detail dashboard is where investigation happens. You arrive here from the Log Summary, with the host already selected. A back-link at the top navigates back to the Log Summary, keeping the flow intact.
At-a-Glance Counts
The top of the screen repeats the same stat panels from the Log Summary — Errors, Warnings, Failed Logins, and Invalid Users — scoped to this host. Having the counts visible while you read through the log panels below means you don’t need to scroll back up to remember what you’re looking for.
Log Volume by Level
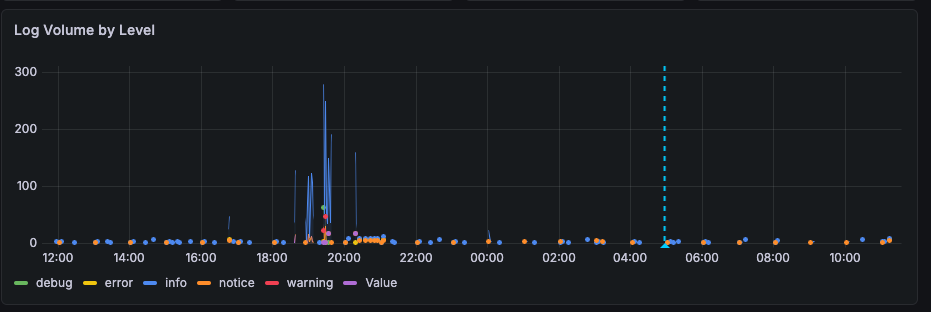 Below the stat panels, a time series shows how log activity broke down across severity levels over the selected time range. Before reading a single log line, this chart tells you when the problem occurred. A spike at 2am in the error series is the first thing that narrows your search. A gradual rise in warning volume over several days tells a different story than a sudden burst — and you can see that difference at a glance before opening any log panel.
The chart also supports annotations — you can click directly on a point in the time series and add a comment to mark it. This is useful during an active investigation: annotate when an incident started, when a change was made, or when a service was restarted. Those markers stay on the chart for the duration of your session, giving you reference points as you work through the log panels below. If you are handing off an investigation to someone else, the annotations help communicate what has already been checked and what the timeline looks like.
Log Panels
The lower half of the dashboard contains three log panels. Each one shows the actual log lines, with timestamps, sorted newest-first. Clicking any line expands it to show all attached Loki labels and the full raw log entry — useful when you need to see exactly which systemd unit generated an entry, or what priority level Promtail assigned it.
All Logs — the complete log stream for this host across all Promtail scrape jobs. This is the unfiltered view: every journal entry, every auth event, every application log that Promtail is collecting. Use this when you want full context around an event — to see what else was happening at the same time as an error, or to trace a sequence of events across multiple services. 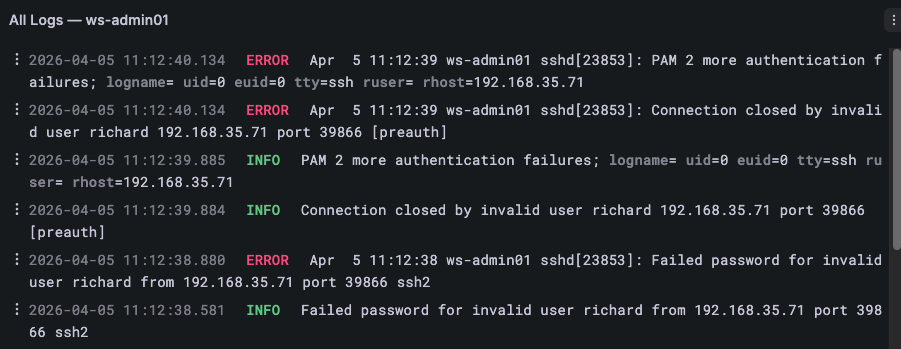
Errors & Warnings — the same log stream as All Logs, but pre-filtered to lines that match error and warning patterns. This is the first panel to check when the Errors or Warnings stat panel is red or yellow. Rather than scrolling through hundreds of normal log lines, you see only the entries that need attention. The filter catches a broad set of severity keywords so nothing slips through on an unusual phrasing. 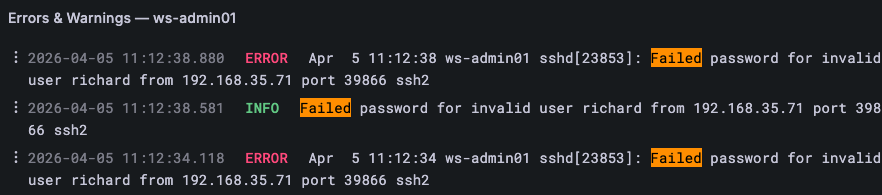
Auth & Security — scoped specifically to the auth log: SSH login attempts, sudo usage, PAM authentication events, and privilege escalation. On Rocky/RHEL hosts this is /var/log/secure; on Ubuntu/Debian hosts it is /var/log/auth.log. This panel is the right place to start when Failed Logins or Invalid Users is elevated — the raw auth log entries show exactly which user, from which IP address, at what time. 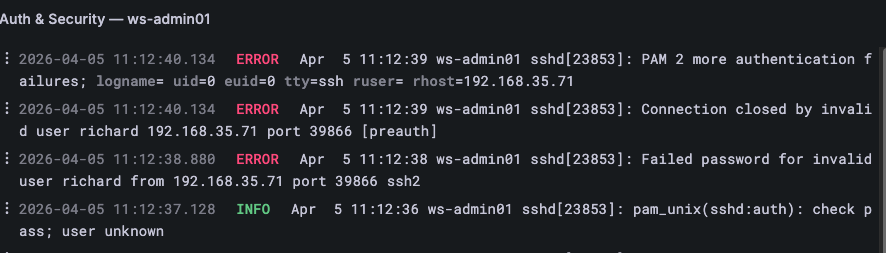
🎯 Why Do This?
In most cases, important notifications get caught — as long as the inbox stays manageable. But when two to three hundred emails are arriving every day, something is eventually going to be missed.
Building better habits is one approach. Building better tooling is more reliable.
These two dashboards do not require you to develop a new habit or remember to check something. They extend the Network Overview you already have — that red error count on a host row is the signal, and two clicks take you from signal to the actual log lines. Network Overview spots the host. Log Summary shows the pattern. Host Logs shows the detail. Each screen does one thing and hands off to the next.
The server administrator is retired. Nobody walks the server room anymore. But Promtail is collecting logs from every host, Prometheus is scraping the error counts, and the summary screen is one tab away.
The information is no longer in an inbox nobody checks.
Part of a Larger Journey
- Article 1: Introduction — Why this project matters and what Linux can offer businesses
- Article 2: Proxmox Virtualization Best Practices
- Article 3: Making Linux Work as a Corporate Desktop
- Article 4: OS Updates on the Corporate Linux Desktop
- Article 5: Enterprise Desktop Update Lifecycle with Kinoite
- Article 6: Bringing Prometheus Monitoring to the Linux Corporate Desktop
- Article 7: Loki: From Naming Servers After Gods to Monitoring Them
- Article 8: OpenSCAP: Compliance Scanning for the Linux Corporate Desktop
- Article 9: Grafana — The Single Pane of Glass
- Article 10: Grafana Network Overview — Every Device, One Screen
- Article 11: Grafana Log Dashboards — From Fleet Overview to Per-Host Detail (this article)
Need Linux expertise? I help businesses streamline servers, secure infrastructure, and automate workflows. Whether you’re troubleshooting, optimizing, or building from scratch — I’ve got you covered. 📬 Drop a comment or email me to collaborate. For more tutorials, tools, and insights, visit sebostechnology.com.
☕ Did you find this article helpful? Consider supporting more content like this by buying me a coffee: Your support helps me write more Linux tips, tutorials, and deep dives.