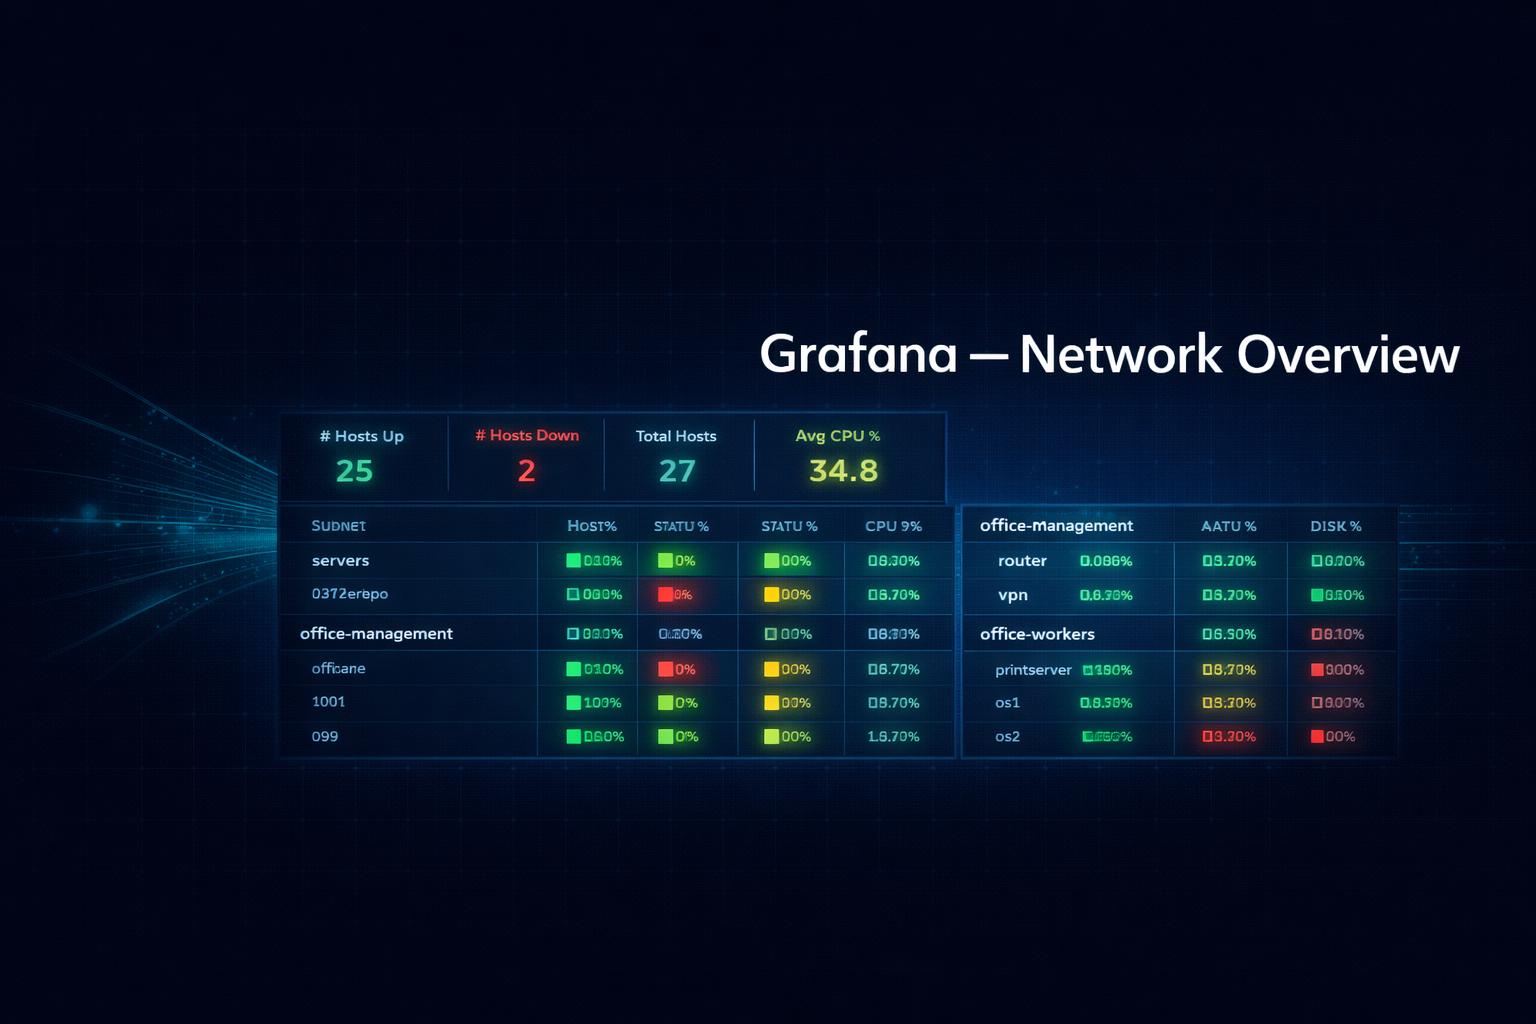
Grafana Network Overview — Every Device, One Screen
“Security is not a product, but a process.” — Bruce Schneier
🐕 The Big Friendly Dog Problem
Until recently, I lived in a small town on the prairies of Canada. Most nights, we didn’t lock our doors — not because we were careless, but because we had two dogs: a Boxer and a Great Pyrenees. Anyone thinking about walking into our house uninvited would have been immediately greeted by two large, enthusiastic animals who wanted nothing more than to jump up and play.
The security was the illusion of the scary-looking dog. They were sweethearts. But to a stranger, that was enough.
A lot of IT security works exactly the same way. A firewall at the perimeter, an antivirus scanner, automatic updates — all of it is real, and all of it matters. But too often, once those boxes are checked, the monitoring stops. Nobody goes back to look. The dogs are on duty. What could go wrong?
The answer is: a lot, quietly, over time. A disk slowly filling. A service restarting every few hours. A host that went offline last night and nobody noticed until a user called. None of it loud enough to page anyone. All of it invisible unless someone is actually watching.
That is the problem this dashboard is built to solve.
This article is part of an ongoing series documenting the build-out of a Linux-based corporate desktop and server environment. The previous article introduced Grafana as the platform that ties the monitoring stack together. This article builds the first practical dashboard: a high-level network overview powered by Prometheus that shows the health of every host at a glance — and links directly to detailed per-host monitoring when you need to dig deeper.
Table of Contents
- What We Are Building
- Organizing the Network by Subnet
- Adding Subnet Labels to Prometheus
- The High-Level Overview
- The Per-Subnet Host Table
- One Click to the Detail
- What Comes Next
🖥️ What We Are Building
The dashboard has one job: answer the question “is anything wrong right now?” as fast as possible.
It is deliberately high-level. It does not show graphs over time or deep metric breakdowns — that is what the per-host detail dashboard is for. This screen is the front door. You open it, you scan it, and either everything is green and you move on, or something is red and you click through to find out why.
The layout has two layers:
At the top — four stat panels showing total hosts up, hosts down, total monitored hosts, and average CPU across the entire environment. These give an instant fleet-wide summary before reading a single row.
Below — one table per network subnet, each listing every host in that segment with five columns:
| Column | What it shows |
|---|---|
| Host | Hostname — click to open the full detail dashboard |
| Status | Online (green) or Down (red) |
| CPU % | Current utilization with colour thresholds |
| Mem % | Memory pressure with colour thresholds |
| Disk % | Root filesystem usage with colour thresholds |
If a row has any red or yellow cells, that host needs attention. One click on the hostname takes you directly to the Node Exporter Full dashboard for that device — pre-filtered, same time range, ready to investigate.
🗂️ Organizing the Network by Subnet
Grouping hosts by subnet makes the dashboard readable at scale. Rather than a flat list of every device, hosts are organized into the logical segments that match how the network is actually used.
In the test environment for this series, the 192.168.35.0/24 network has three segments:
| Segment | Range | Label |
|---|---|---|
| Servers | .200 and above | servers |
| Office Management | .1 – .44 | office-management |
| Office Workers | .100 – .199 | office_worker |
Each segment gets its own table on the dashboard. A problem in the servers subnet is immediately distinguishable from a problem on an employee workstation — without reading IP addresses.
This approach scales cleanly. Adding a second office location means adding a new subnet label and a new table. No agents need to be reconfigured.
🏷️ Adding Subnet Labels to Prometheus
Prometheus uses file_sd_configs — file-based service discovery — to define scrape targets. Each target entry carries labels that get attached to every metric scraped from that host. This is where the subnet and host labels are defined.
A targets file for the servers subnet:
1
2
3
4
5
6
7
8
9
10
11
12
13
14
15
- targets:
    - '192.168.35.220:9100'
  labels:
    subnet: servers
    host: ostreerepo
    environment: production
    os: rocky9

- targets:
    - '192.168.35.217:9100'
  labels:
    subnet: servers
    host: grafana
    environment: production
    os: rocky9
The subnet label is what each PromQL query filters on to populate its table. The host label is the human-readable hostname that appears in the Host column and drives the drill-down link.
Prometheus picks up changes to file_sd target files automatically — no restart needed.
📊 The High-Level Overview
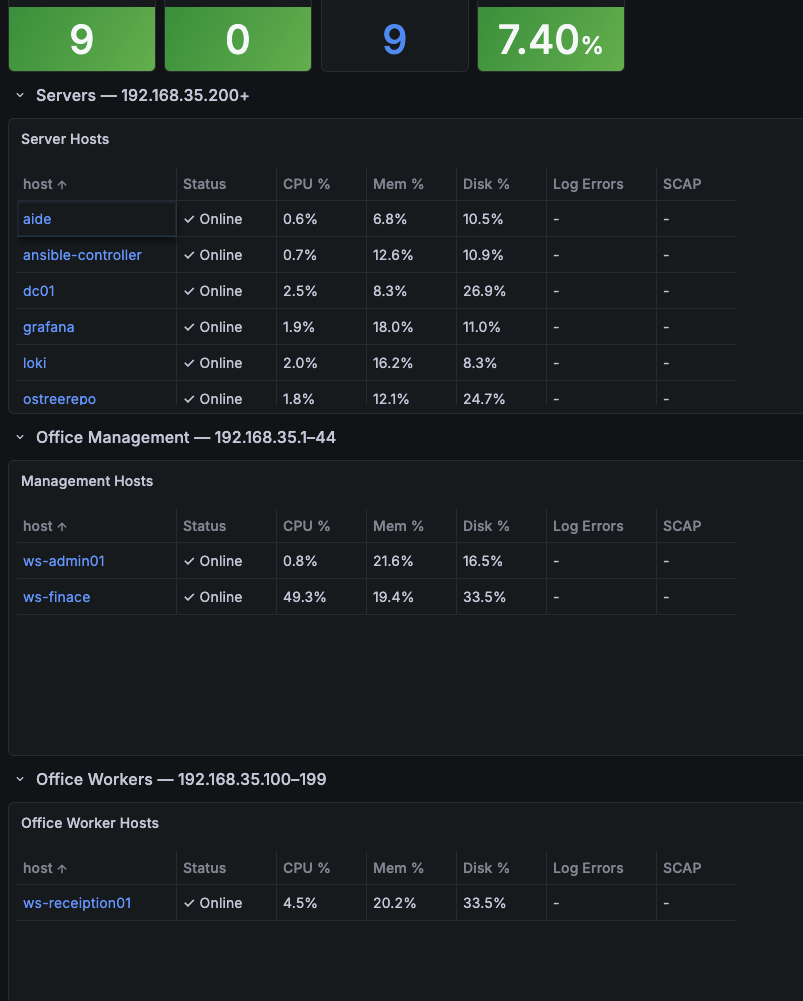
The network overview dashboard showing the summary stat panels and per-subnet host tables.
The four stat panels at the top of the dashboard give a fleet-wide pulse check. All four pull from the global node_exporter job without any subnet filtering — they reflect the entire monitored environment.
# Hosts Up
count(up{job="node_exporter"} == 1)

# Hosts Down
count(up{job="node_exporter"} == 0) or vector(0)

# Total Hosts
count(up{job="node_exporter"})

# Avg CPU %
avg(100 - (avg by(instance) (
  rate(node_cpu_seconds_total{mode="idle", job="node_exporter"}[5m])
) * 100))
The or vector(0) on the Hosts Down query is a small but important detail — without it, when no hosts are down, Prometheus returns an empty result and the panel shows No data instead of 0.
These four numbers are the dogs at the door. Green across the board, move on. Red in Hosts Down, scroll to the tables and find it.
📋 The Per-Subnet Host Table
Each subnet gets a table panel that lists every host in that segment with its current health metrics. The table is built from four Prometheus queries running simultaneously, merged into a single frame by the shared host label.
# Status — is the host reachable?
up{job="node_exporter", subnet="servers"}

# CPU %
100 - (avg by(instance) (
  rate(node_cpu_seconds_total{mode="idle", job="node_exporter", subnet="servers"}[5m])
) * 100)

# Memory %
100 - (node_memory_MemAvailable_bytes{job="node_exporter", subnet="servers"}
     / node_memory_MemTotal_bytes{job="node_exporter", subnet="servers"} * 100)

# Disk % (root filesystem)
100 - (node_filesystem_avail_bytes{job="node_exporter", subnet="servers",
         mountpoint="/", fstype!~"tmpfs|overlay"}
     / node_filesystem_size_bytes{job="node_exporter", subnet="servers",
         mountpoint="/", fstype!~"tmpfs|overlay"} * 100)
Each query uses legendFormat: "" so Grafana can join the results by hostname into a single row per device.
Colour Thresholds
The colouring is intentionally minimal. Healthy rows are plain — no background colour, no visual noise. Colour only appears when something needs attention.
A dashboard full of green is just as hard to read as a dashboard full of red. When every cell is lit up, nothing stands out. The goal is a screen that is mostly quiet, where yellow and red are the exception rather than the wallpaper.
| Column | Normal | Warning | Critical |
|---|---|---|---|
| Status | Online (plain) | — | Down (red) |
| CPU % | < 60% (plain) | 60–85% (yellow) | > 85% (red) |
| Mem % | < 70% (plain) | 70–85% (yellow) | > 85% (red) |
| Disk % | < 75% (plain) | 75–90% (yellow) | > 90% (red) |
A healthy environment is a quiet one. You should be able to open this dashboard, see a screen of plain rows, and close it in under ten seconds. When something turns yellow or red, you do not need to go looking — it finds you.
🔗 One Click to the Detail
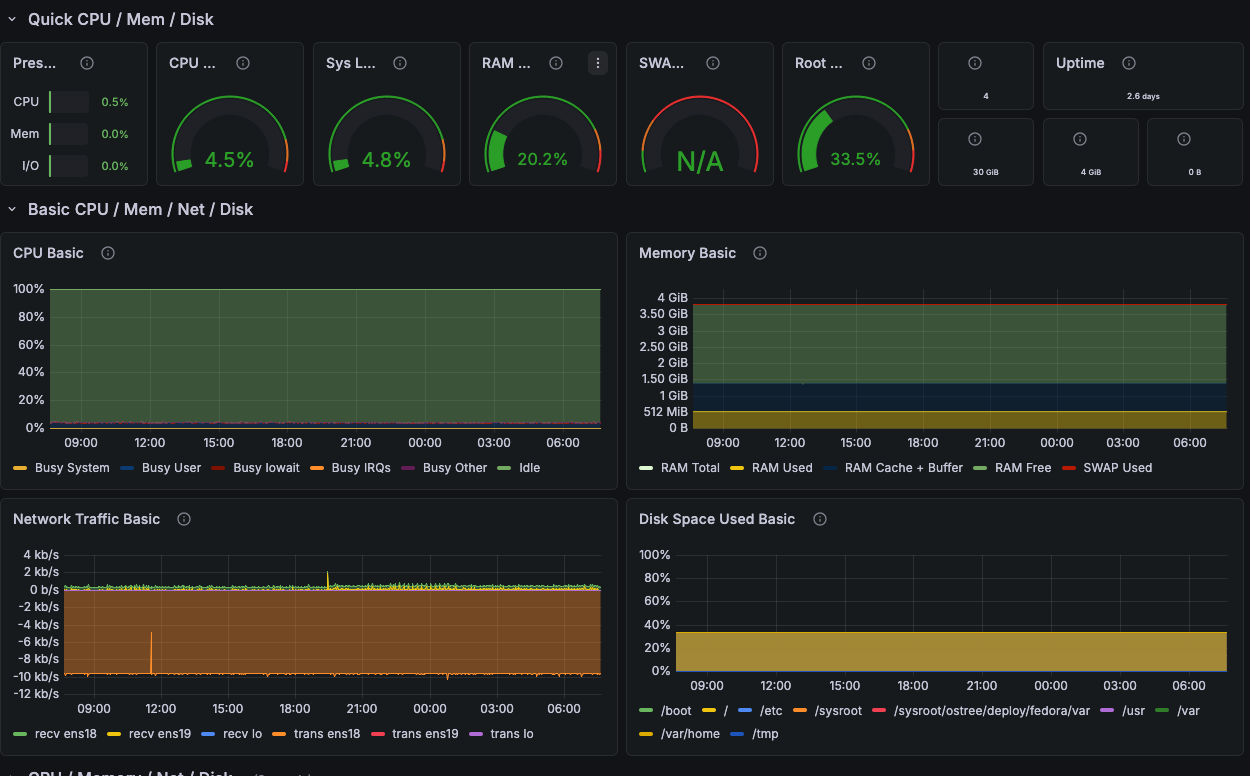 The Node Exporter Full dashboard showing detailed metrics for a single host.
The Host column in each table is not just a label — it is a link. Clicking any hostname opens the Node Exporter Full dashboard for that specific host, pre-filtered and ready to investigate.
The Node Exporter Full dashboard provides the deep view: CPU history over time, per-core breakdown, memory graphs, disk I/O, network throughput, filesystem details, and system load. Everything the overview deliberately leaves out is in there.
The link uses Grafana’s ${__data.fields.instance} variable to inject the correct scrape target for each row automatically:
1
2
3
4
5
http://grafana:3000/d/rYdddlPWk/node-exporter-full
  ?var-job=node_exporter
  &var-node=${__data.fields.instance}
  &from=now-24h
  &to=now
The instance field — the IP address and port of the Node Exporter — is carried in the table data but hidden from display. It exists purely to make the link work correctly for every row without any manual configuration per host.
This is the two-screen workflow:
- Overview — open it, scan it, identify which host needs attention
- Node Exporter Full — click the hostname, see the full history, find the cause
The overview tells you something is wrong. The detail tells you what and why.
Unlike the dog, this dashboard never gets distracted by a squirrel.
🔭 What Comes Next
This dashboard is the foundation. The next two additions are already planned for upcoming articles:
Log visibility — adding a Loki column to the table that shows a count of error-level log entries from each host over the last 15 minutes. A host with a high log error count alongside normal CPU and memory tells a different story than a host with high CPU alone. That combination is where Loki earns its place next to Prometheus.
Compliance state — adding an OpenSCAP column showing the current compliance score for each host from the SCAPinoculars exporter. A device drifting out of compliance shows up in the same row as its resource metrics, on the same screen, without running a separate report.
Both columns extend the same table. The structure is already there — it is just waiting for the data.
For now: one dashboard, every device, five columns, one click to the details. That is already more visibility than most small businesses have — and it runs entirely on open-source tools.
Part of a Larger Journey
- Article 1: Introduction — Why this project matters and what Linux can offer businesses
- Article 2: Proxmox Virtualization Best Practices
- Article 3: Making Linux Work as a Corporate Desktop
- Article 4: OS Updates on the Corporate Linux Desktop
- Article 5: Enterprise Desktop Update Lifecycle with Kinoite
- Article 6: Bringing Prometheus Monitoring to the Linux Corporate Desktop
- Article 7: Loki: From Naming Servers After Gods to Monitoring Them
- Article 8: OpenSCAP: Compliance Scanning for the Linux Corporate Desktop
- Article 9: Grafana — The Single Pane of Glass
- Article 10: Grafana Network Overview — Every Device, One Screen (this article)
Need Linux expertise? I help businesses streamline servers, secure infrastructure, and automate workflows. Whether you’re troubleshooting, optimizing, or building from scratch — I’ve got you covered. 📬 Drop a comment or email me to collaborate. For more tutorials, tools, and insights, visit sebostechnology.com.
☕ Did you find this article helpful? Consider supporting more content like this by buying me a coffee: Your support helps me write more Linux tips, tutorials, and deep dives.